

PostgreSQL, RED, Golden Signals: getting started
Golden Signals and RED methods are the monitoring templates which define key metrics required for monitoring services. Earlier these methods were known only to monitoring administrators and SRE engineers. But now, the topic of application instrumenting is not new and these methods are known to most people.
In this post I will review different usages of RED and Golden Signals with PostgreSQL.
Stats subsystems in Postgres were written in times when Golden Signals and RED did not exist and in my opinion this might have been a reason for several disadvantages that make the implementation of RED or Golden Signals over existing stats challenging. Let’s review stats that Postgres offers and which could help with the implementation of RED and Golden Signals and propose ways on how to do that. In fact, it is not that hard as it may seem.
I’ve been using Golden Signals and RED quite some time and there are several reasons why you should give these methods a try:
- Using metrics provided by these methods allows to quickly determine a general state of the service.
- When there is a variety of other metrics available , these methods allow you to focus on the right direction and ignore the less important ones.
- These are the universal methods which are suitable not only for web services, but also good for system services that are not used for servicing user requests directly.
- The methods are a good starting point for covering basic monitoring requirements for almost all types of services.
In general, if you are faced with a new and unknown service that should be monitored, you can take Golden Signals or RED and use them as a checklist to configure and collect necessary metrics. By using these metrics we could make a dashboard, which provides us with basic view about our service state. As a next step you can move onto implementing monitoring of other service-specific parts. Having said that, it would be incorrect to think that these methods are a “silver bullet” and can cover all needs of additional metrics.
Well, I hope this was convincing, now let’s move to Postgres.
Golden Signals and RED are about measuring quantitative parameters of traffic processed by a service, it’s not called Rate Errors Duration for nothing. A few examples for RED include:
- Request rate — number of requests per second your services are serving.
- Request errors — number of failed requests per second.
- Request duration — time spent on servicing requests.
In Golden Signals it’s pretty much the same except the vocabulary is different (Latency, Traffic, Errors) and it includes “Saturation” — the amount of work that can’t be serviced at a particular moment but needs to be worked though in a particular moment, so it must be put in the queue.
Despite the fact that these methods are considered for use with HTTP (micro)services, they could also be used for other request-oriented services including RDBMS. RDBMS of any kind could be considered as a service which handles client queries (Requests); these queries can be successful or unsuccessful/faulty (Errors); time is spent when executing queries (Duration); queries are processed concurrently using Locks and access can be blocked resulting in queues (Saturation).
Small detour: Before we continue let’s clarify what will be meant under the «request» term. Is it an SQL query or SQL transaction? For the purposes of this blog post under “request” term I will mean an SQL query, because most of the applications operate queries and only if necessary wrap them into a transaction. Hence, one request is one query. Even from the point of application’s own observability, it has to provide its own RED metrics and add every SQL query with metadata about it (request_id, info about sender, method or controller, etc.).
Requests.
Let’s begin from R — requests. Requests are clients’ activity, no clients — no requests. For watching on clients activity there are some stat views in Postgres. For now, only one is of interest to us.
pg_stat_statements. This is an extension which should be configured and enabled separately. Extension provides a pg_stat_statement view which contains per-statement stats. There are many stats for every executed statement, but for tracking requests we need only one field called “calls” which shows the total number of times the specific statement was executed. Note that pg_stat_statements contains info only about successfully executed queries.
However, you need to be careful with configuration of pg_stat_statements. Extension can track statements in two modes. Take a look at pg_stat_statement.track, this parameter has two settings. The first one is “top”, it means to track only top-level statements. The second one is “all” which triggers the tracking of all statements, even those that are nested into stored procedures and functions. For better overview of “requests”“top” is preferable because if a client sends a request for a function, all statements within a function are executed by backend on the server side and can’t be accounted for as by the separate requests from an application.
To get the necessary data it is enough to make a simple query to pg_stat_statements.
SQL> SELECT sum(calls) FROM pg_stat_statements;
The results should be wrapped into a metric using tools specific for the existing monitoring ecosystem. For example, for Prometheus this should be done by an exporter, for Zabbix it will be a UserParameter.
Another alternative that you can think of is pg_stat_activity and pg_stat_database. These, however, are not good options pg_stat_activity is not suitable, because it shows activity snapshots which are relevant only at the moment of capture, and what happens between these moments is unknown. pg_stat_database view has a potentially interesting xact_commit field, but it’s not suitable either because it only accounts for transactions. We will use this view later though.
Errors.
To estimate the number of errors or “failed requests” let’s take a look at the pg_stat_database which was mentioned earlier. This view contains “xact_rollback” field with a per-database number of transactions that was rolled back. Usually, rollbacks occur due to error within a particular transaction, or if an application itself rolls back a particular transaction. Hence, only one error within a transaction is enough for a whole transaction to roll back. Important note, single executed query (even if it is not wrapped into BEGIN … END block) also considered a transaction, and failed query will be accounted in xact_rollback. Hence xact_rollback is enough for tracking errors in requests.
For getting a number of errors, no need for deep knowledge of SQL.
SQL> SELECT sum(xact_rollback) FROM pg_stat_database;
But there is a small disadvantage, such approach shows only errors related to the requests processing. But during runtime there other kinds of errors could occur that are not related to requests processing. These errors could happen too rarely, but it’s important to know about them. Unfortunately there is no handy view with errors stats and such information could be retrieved only from logs.
Duration.
To calculate the accounting time spent on requests processing we will need pg_stat_statements, specifically the “total_time” field. This field shows the total time in milliseconds the statement was executed (including the waiting time). Hence for getting summary time of all requests we should sum up all the values.
SQL> SELECT sum(total_time) FROM pg_stat_statements;
Retrieved result is in milliseconds and optionally could be multiplied, because for Prometheus for example, it’s desirable to cast all time metrics in seconds.
Ideally, the requests duration could be returned as an histogram with distribution of requests per durations ranges, but pg_stat_statements performs the aggregations under the hood and exposes only its own aggregates, such as total_time, min_time, max_time, mean_time and stddev_time. In addition, in the released Postgres 13 there are new timings related to the query planning, but I will focus on it some other time.
Saturation.
And lastly, the saturation that exists only in Golden Signals. To remind, saturation is the state in which a request processing is queued, so in the context of query processing it’s important to see situations when queries and not executed (queries don’t contain errors).
— A little bit of theory here —
The number of simultaneous connections to the database instance is limited by max_connections parameter. In practice, it is rare to reach this limit, usually problems start a bit earlier. To reach saturation, two conditions should be met: 1) idle transactions, 2) sustainable transactions rate with updates/deletes inside. If these two conditions are met, you may see the following:
- Application within transaction updates rows and then leaves the transaction opened (in hope to return to it later), but it doesn’t return.
- Concurrent updates become locked by these idle transactions and are queued and waiting until the first transaction finishes.
- Application opens new connections, sends requests and they are queued too and extrude all other activity until max_connections is reached.
- After that all new connections are rejected with an error. Or until the first transaction finishes by itself or is cancelled by the administrator.
—
For detecting cases when queries are queued we need pg_stat_activity. This stat is not ideal, however for no better option let’s use it.
— Why is this stat not ideal? —
Up until now all stats were collated by COUNTERS in the background. Counters are handy because they don’t lose values (resets or overflows of counters are rare). If the counter is fast-moving or slow-moving we could make a rate chart and see how value changes over time. All the stats taken from pg_stat_activity could be considered as GAUGES only because pg_stat_activity doesn’t contain counters and returns stats snapshot. Hence it’s impossible to know what happened in between snapshots. . And there could have happened a lot, for example, with OLTP workload during one second a database could have processed thousands of queries or transactions and when we are working with gauges we can’t identify that. This is a significant disadvantage of gauges.
—
If we ignore gauges disadvantages, in general, a minute interval between stats measurements will be sufficient to detect the problem. If it is possible to collect stats more frequently it would be nice too. So we need:
- The total number of connected clients and their states (active, idle in transaction, waiting)
SQL> SELECT

count(*) FILTER (WHERE state IS NOT NULL) AS total,

count(*) FILTER (WHERE state = 'idle') AS idle,

count(*) FILTER (WHERE state IN ('idle in transaction', 'idle in transaction (aborted)')) AS idle_in_xact,

count(*) FILTER (WHERE state = 'active') AS active,

count(*) FILTER (WHERE wait_event_type = 'Lock') AS waiting,

count(*) FILTER (WHERE state IN ('fastpath function call','disabled')) AS others,

FROM pg_stat_activity WHERE backend_type = 'client backend';
Also we need information about how long transactions stay idle and how long clients stay in waiting state. For that we need xact_start field — timestamp when transaction was started, and state_change — timestamp when state of the client was changed — in fact, this is the time when client becomes active and starts to wait.
- Longest idle transaction
SQL> SELECT coalesce(max(extract(epoch FROM clock_timestamp() - xact_start)),0) AS max_idle_seconds FROM pg_stat_activity WHERE state IN ('idle in transaction', 'idle in transaction (aborted)');- Longest time when a client is in a waiting state.
SQL> SELECT coalesce(max(extract(epoch FROM clock_timestamp() - state_change)),0) AS max_idle_seconds FROM pg_stat_activity WHERE wait_event_type = 'Lock';
As you can see, the queries execution takes longer than previously, but in general the process is not complicated.
Received values also should be incorporated into metrics.
Conclusion.
To add metrics based on Golden Signals or RED methods to Postgres monitoring basic knowledge of SQL and some stats views is needed. Necessary stats are located in different views, it’s not very convenient, but it is not critical either. For requests rate you need pg_stat_statements.calls. For request errors you need pg_stat_database.xact_rollback. Requests duration is based on pg_stat_statements.total_time. Saturation could be calculated using state, wait_event_type, xact_start, state_change from pg_stat_activity.
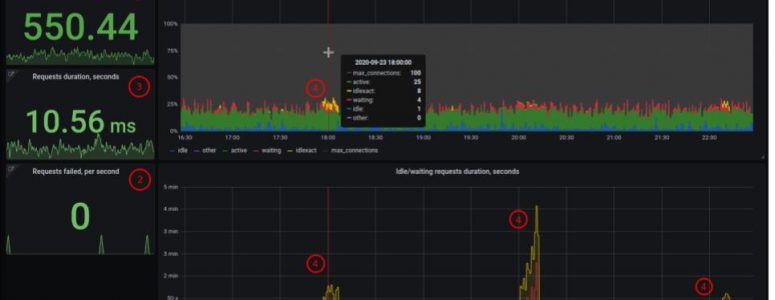
Finally, you should have six metrics, using them you could create an overview dashboard with two or three panels and charts which could be supplied with drilldown links to more extended dashboards or charts. In general, at this point, it is possible to go ahead and extend Postgres monitoring further.

How to use a dashboard like that?
- Check the requests rate. If there are too many or too few requests than usual, we should find out the reason for that. Where do these requests come from? Is everything OK with cache? Or why are there too few requests? Are applications alive?
- Check the errors. If there are no errors, it’s good. Any errors? It is worth checking logs for errors and eliminating the causes.
- Check the duration. If time grows up, go to the queries. What queries executed longer than others and why?
- Check the saturation. If there are any idle transactions or waiting clients and they go up, then go to the database console and check which applications they are related to. Most probably to solve that you will need to check your application, and if needed cancel the idle transactions.
That’s about it, folks. Hope you found this helpful, let me know in the comments below if you have any questions and share how you use Golden Signal and RED methods in your setting.